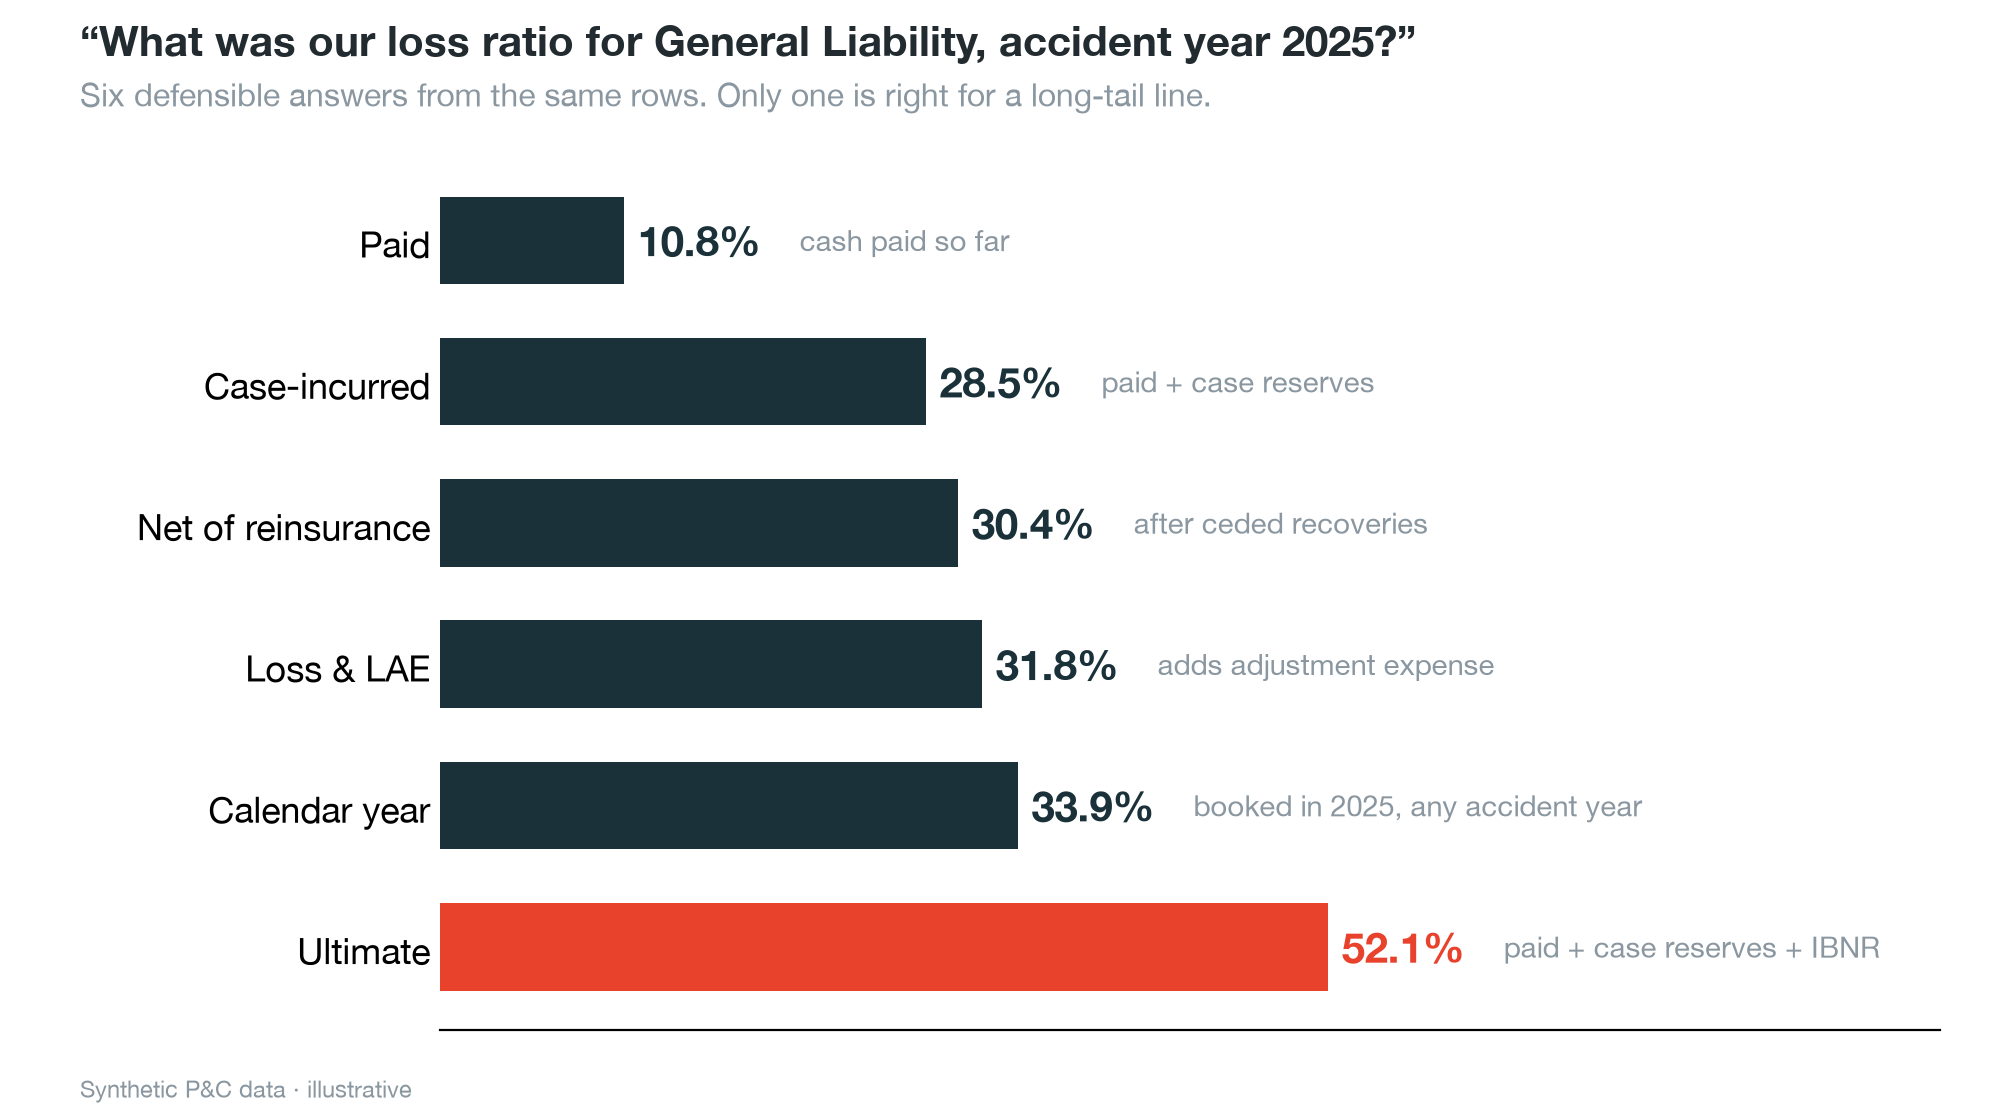
Ask a data team a simple question: "What was our loss ratio for General Liability, accident year 2025?"
In the book of business I'm about to show you, there are six defensible answers: 10.8%, 28.5%, 30.4%, 31.8%, 33.9%, and 52.1%. Every one of them comes from the same rows, every one is a real loss ratio that an actuary would recognize, and the spread between the lowest and the highest is nearly 5x.
A new analyst hired onto the actuarial team would be told on day one which one is the house answer. They'd learn that General Liability is a long-tail line, so it's reported on the ultimate basis, and that nobody divides by written premium. An AI coworker like Genie can write the SQL on day one, but it hasn't had that conversation. Unless someone gives it that context, it picks one of the six, states it confidently, and doesn't tell you which.
This post treats that as an onboarding problem. It covers what an ontology is, why it matters more now that an AI coworker is reading your data, and how the Genie Ontology on Databricks lets you write your definitions down once, govern them, and have every consumer, human or AI, use them. I'll work one example end to end, with real queries and real numbers, and show what each piece of the ontology adds to the answer.
TL;DR - An ontology is the shared set of entities, relationships, terms and rules that says what your data means. - In Databricks, the Genie Ontology combines context you model and govern in Unity Catalog (metric views, domains, Pages, certification) with context Genie infers (metadata, keys, lineage, usage). - On one General Liability question, the answer moved from 10.6% to a correct, cited 52.1% as context was added. The model never changed. - Only some pieces change the number. Others make the answer consistent, scoped, trusted, or provable. All of them matter.
A note on the data before we start. Everything below runs on a synthetic property and casualty dataset I built for this purpose: about 120,000 policy terms across personal auto, homeowners, farm, and commercial lines, 2022 through 2026. No real company data is involved, loss development is estimated with a standard chain-ladder method, and nothing here is actuarial work product. The dataset is not public, so treat the numbers as an illustration of the mechanism and rebuild the steps on your own data.
In philosophy, ontology is the study of what exists. In computer science, an ontology is a formal, explicit description of the things in a domain and how they relate. A working one names four kinds of thing:
The first three describe the shape of the data. The fourth is where most of the value, and most of the argument, lives. A schema tells you a column called paid_loss exists. It does not tell you that paid loss is an incomplete picture of a young General Liability year, or that nobody should divide it by written premium.
Insurance is an unusually good place to feel this: loss ratio, combined ratio, IBNR, ultimate, earned, written, gross, net, ex-cat, accident year, policy year. Each is a small decision with real money attached. Insurers have always had an ontology. It just lived in actuarial memos, a BI tool, and the head of whoever has been there twenty years.
For a long time, that was fine. A human analyst took a request, applied judgment, and handed back a number. If the request was ambiguous, they asked a clarifying question or applied the house convention.
Three things changed.
First, the consumer of your data is increasingly a machine. Natural language interfaces to data are now broadly available. A business user types a question, a model writes SQL, and an answer comes back in seconds. That is a real step forward in access, and it removes the human who used to apply the convention.
Second, the AI is now acting like a coworker, not a search box. Databricks describes Genie as drawing on "the most relevant and trusted assets, including certified Genie Spaces, governed dashboards, and Databricks Apps" (source); it answers in plain language, and is asked questions that people will act on. A coworker is only as good as what they've been told about how your business works.
Third, models are good at the part that was never the bottleneck. A current model writes competent SQL. It can join tables, group, and filter. What it cannot do is invent context that isn't in front of it. If the schema has no IBNR column, no query it writes can return an ultimate loss ratio. If three views look equally plausible, it will choose among them without knowing which one your finance team stopped trusting last year.
The argument that follows from this is that for enterprise questions, context is the scarce input, not model capability. I'll be careful about how far I take that, because it is easy to overclaim. I am not saying models don't matter. I'm saying that on questions where the right answer depends on your definitions, a better model reading the same ambiguous context is still guessing, just more fluently. In the experiment in this post the model is held constant, and the answer moves from 10.6% to 52.1% purely because of what the model is given to read.
Databricks frames it the same way in its product material: Genie's answers should be "grounded in your own governed data and knowledge, not a generic model."
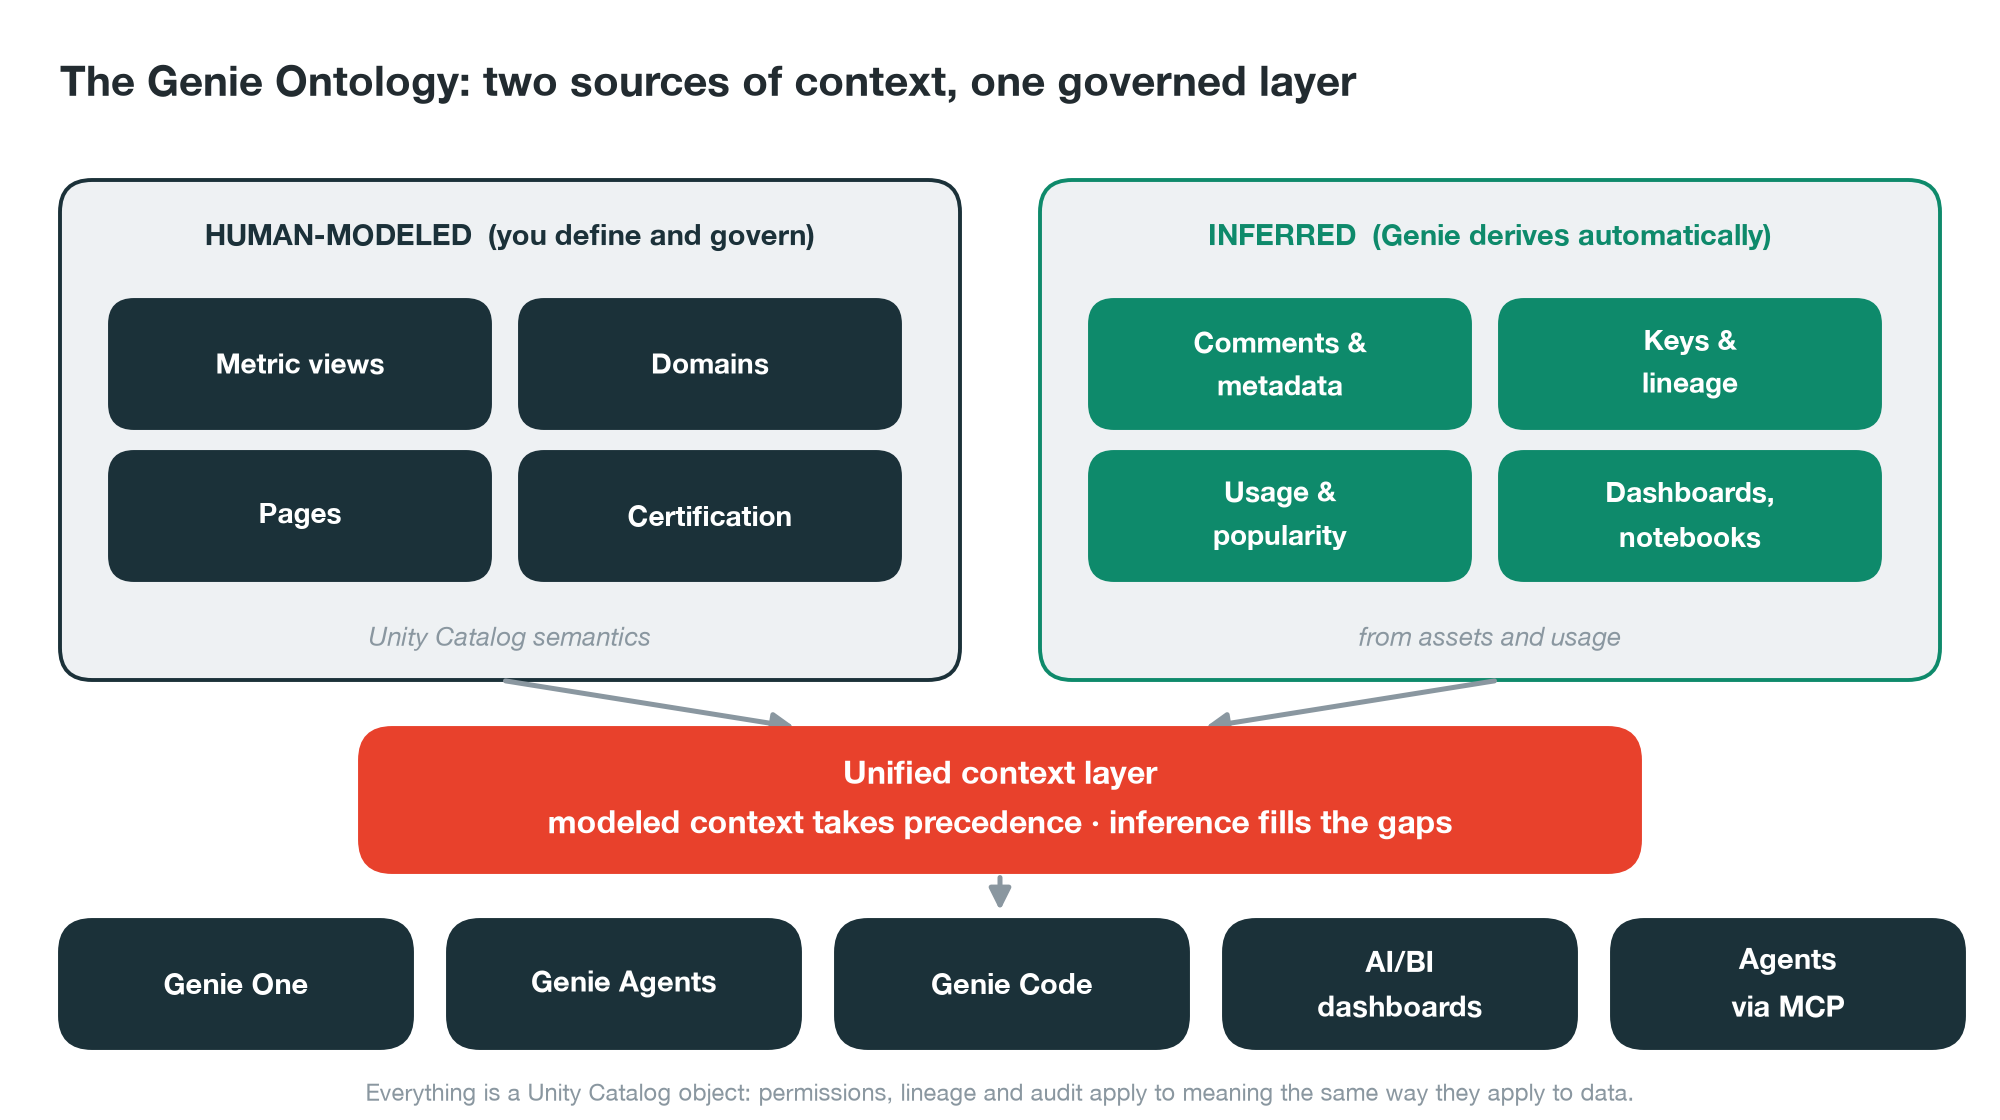
Databricks calls this layer the Genie Ontology. The documentation describes two sources of context that combine into one:
Per the docs, "Genie One combines this modeled context with context it infers automatically," forming a unified context layer. Where you have modeled something, that takes precedence over inference. Where you haven't, inference fills in.
The product page describes the ontology as "a continuously improving, automatically inferred knowledge graph of business terms, entities and KPIs that grounds Genie answers and actions," and says it ranks what it finds by authority and usage while respecting source permissions.
One property is worth pausing on.
It isn't a new object you create. There is no CREATE ONTOLOGY. The ontology is the aggregate meaning assembled from governed Unity Catalog objects you already manage, plus what Genie infers. That is why it can inherit Unity Catalog's permissions, lineage, and audit trail rather than needing its own governance story.
system.certification_status tag with values certified and deprecated. In insurance terms: The stamp that says this is the reserving table we trust, and that legacy view is retired (Certify or deprecate)Around these sit the pieces that make a Genie Agent itself behave: table and column descriptions, primary and foreign keys, instructions, example SQL, verified answers, and benchmarks. They aren't part of "Unity Catalog semantics" in the strict sense, but they are context, and I'll treat them as part of the picture.
A note on maturity, because the platform is moving: at the time of writing, Pages are documented as Beta, the Domains REST API is marked Beta, and certification automation is marked beta. Check the linked pages for current status before you plan around any of them.
Here is the book I'll use. It has seven sub-lines. Short-tail lines like private passenger auto and homeowners pay most claims within months. Long-tail lines like General Liability and Workers Compensation pay out over many years. The question:
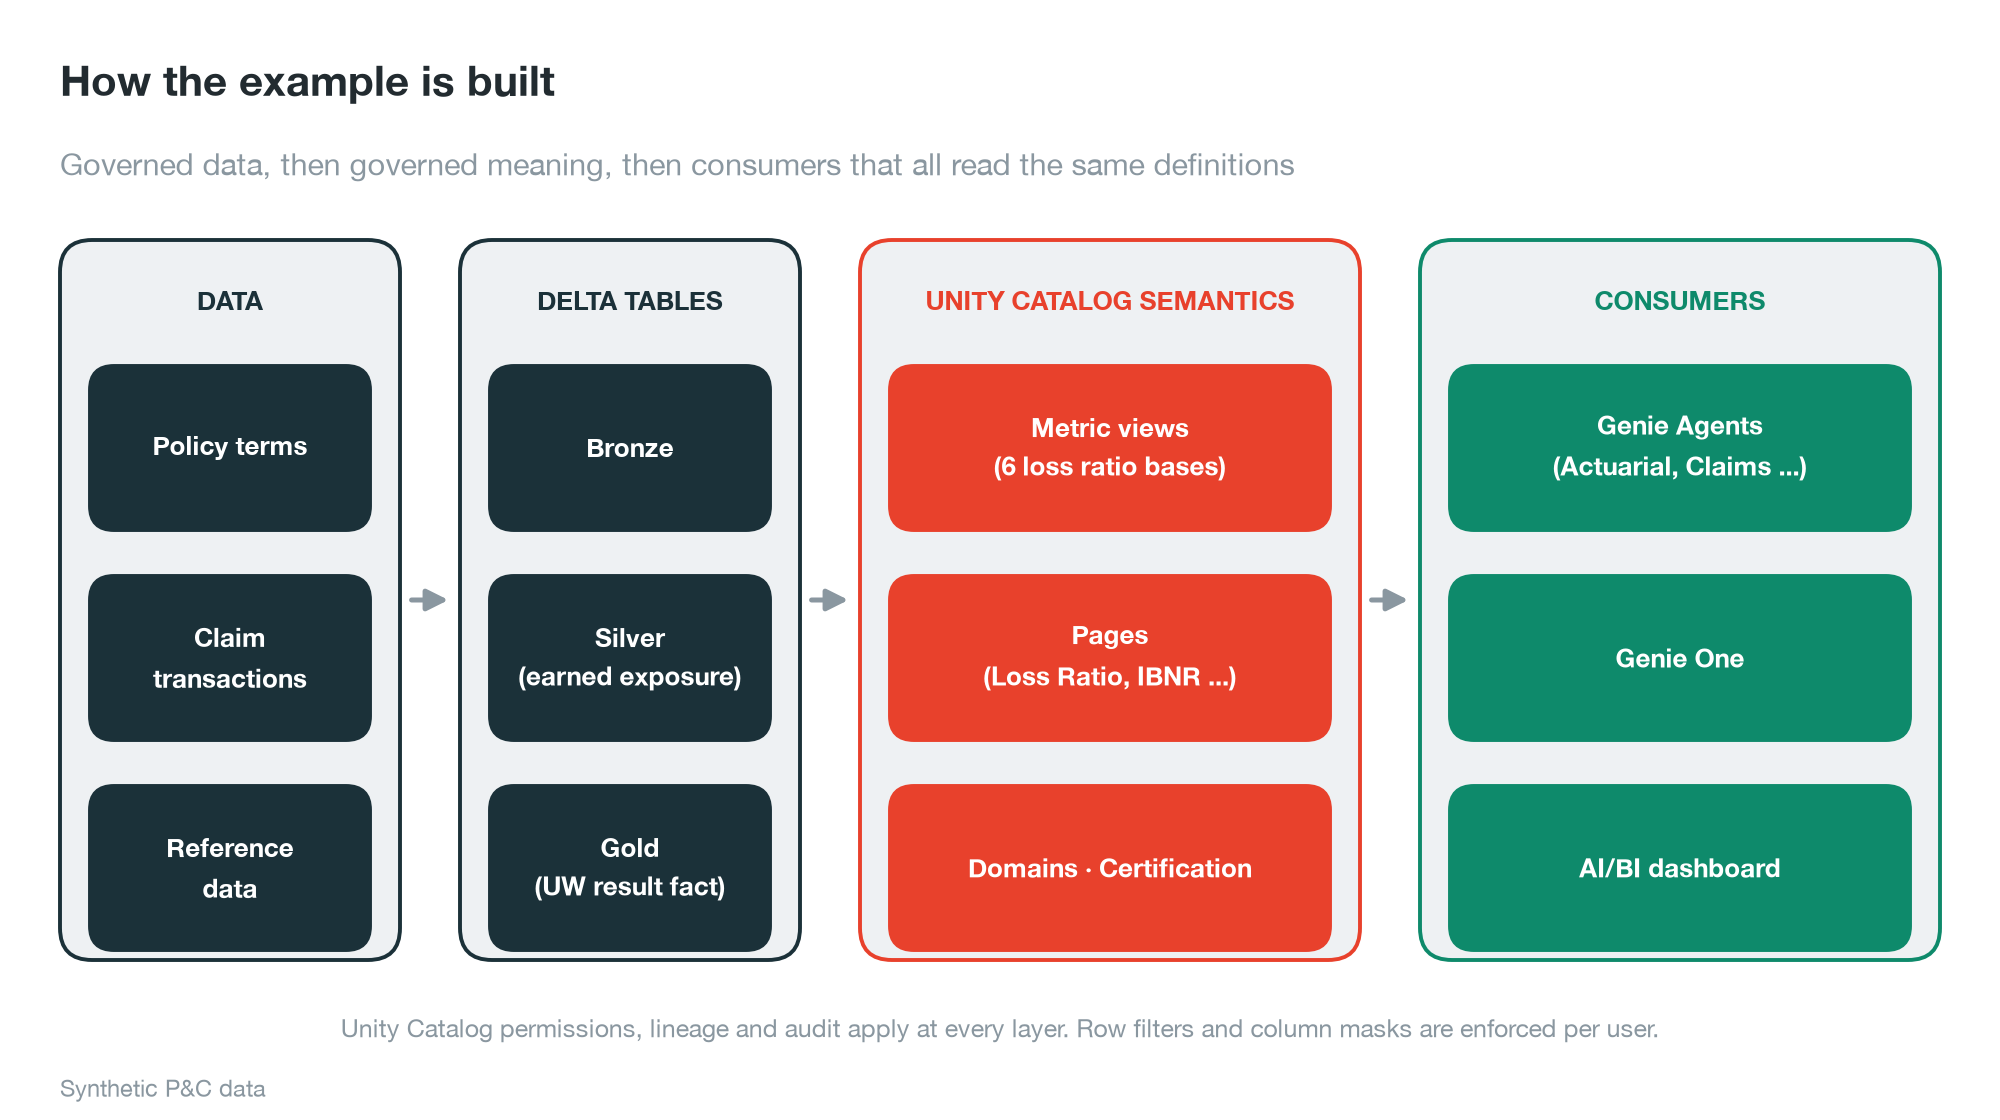
The pipeline is ordinary: raw policy and claim data land in Delta tables (bronze, silver, gold). The ontology is the layer on top, and the consumers all read from it.
"What was our loss ratio for General Liability, accident year 2025?"
A loss ratio is losses divided by earned premium. The trouble is that "losses" and a few other terms each have several legitimate meanings. The same question can be read on six independent axes: which loss measure (paid, case-incurred, ultimate), whether to include adjustment expense, gross or net of reinsurance, accident year or calendar year, whether to strip out catastrophes, and which premium goes in the denominator.
Here is General Liability, accident year 2025, with the underlying dollars.
And the six answers, each one a different arithmetic choice on those same numbers:
Which one is right? For this line, the ultimate loss ratio. General Liability claims take years to be reported, litigated, and settled. At twelve months, this accident year has paid about 21% of its estimated ultimate loss (892,495 ÷ 4,305,097). The paid number measures how far along the claims process is, not how profitable the business is.
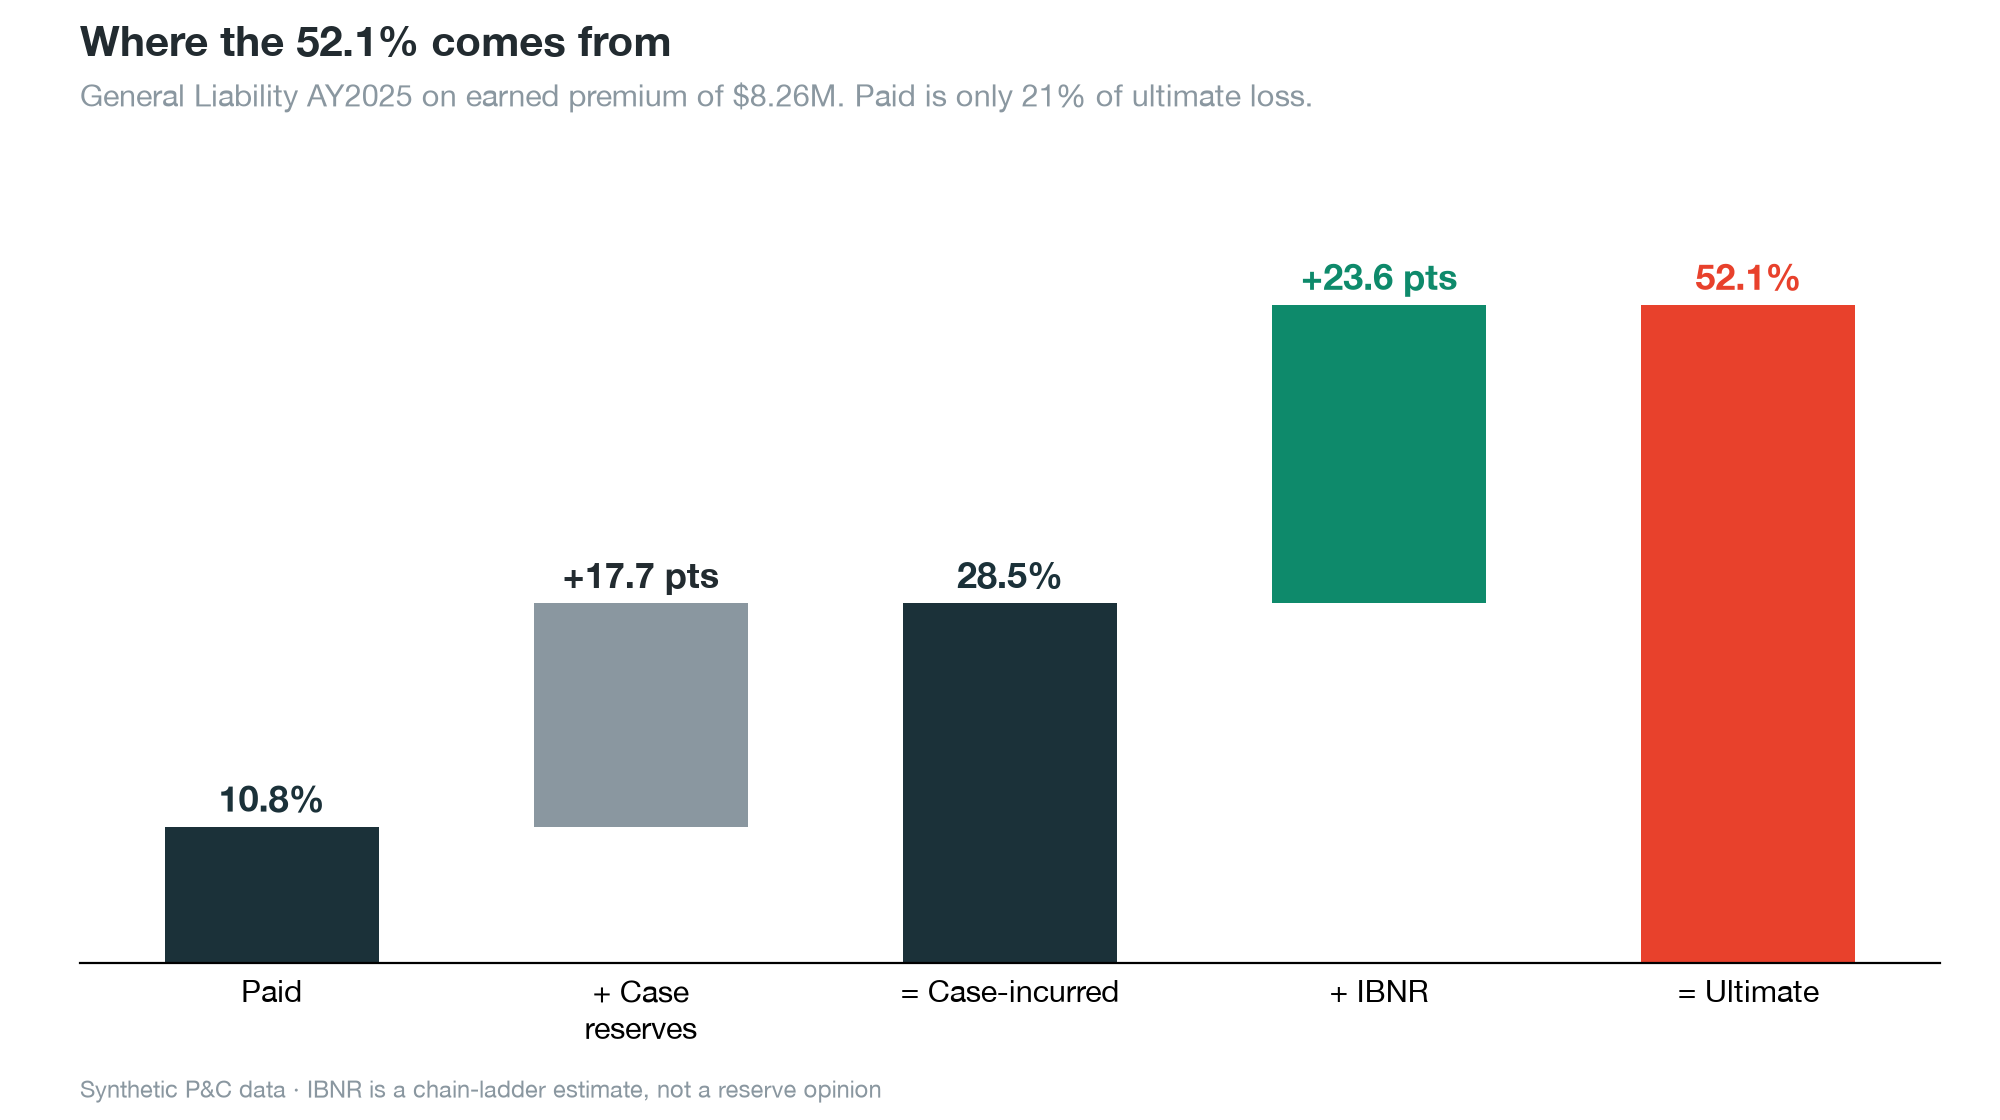
The picture shows why. Of the 52.1 points, only 10.8 have been paid. Another 17.7 sit in case reserves on known claims. The last 23.6 points are IBNR, an actuarial estimate of claims that have occurred but aren't fully in the system yet, plus further development on known claims. A paid or even a case-incurred view leaves out nearly half of the cost.
Suppose a portfolio review ranks lines by profitability using paid loss ratio, the way a raw query would.
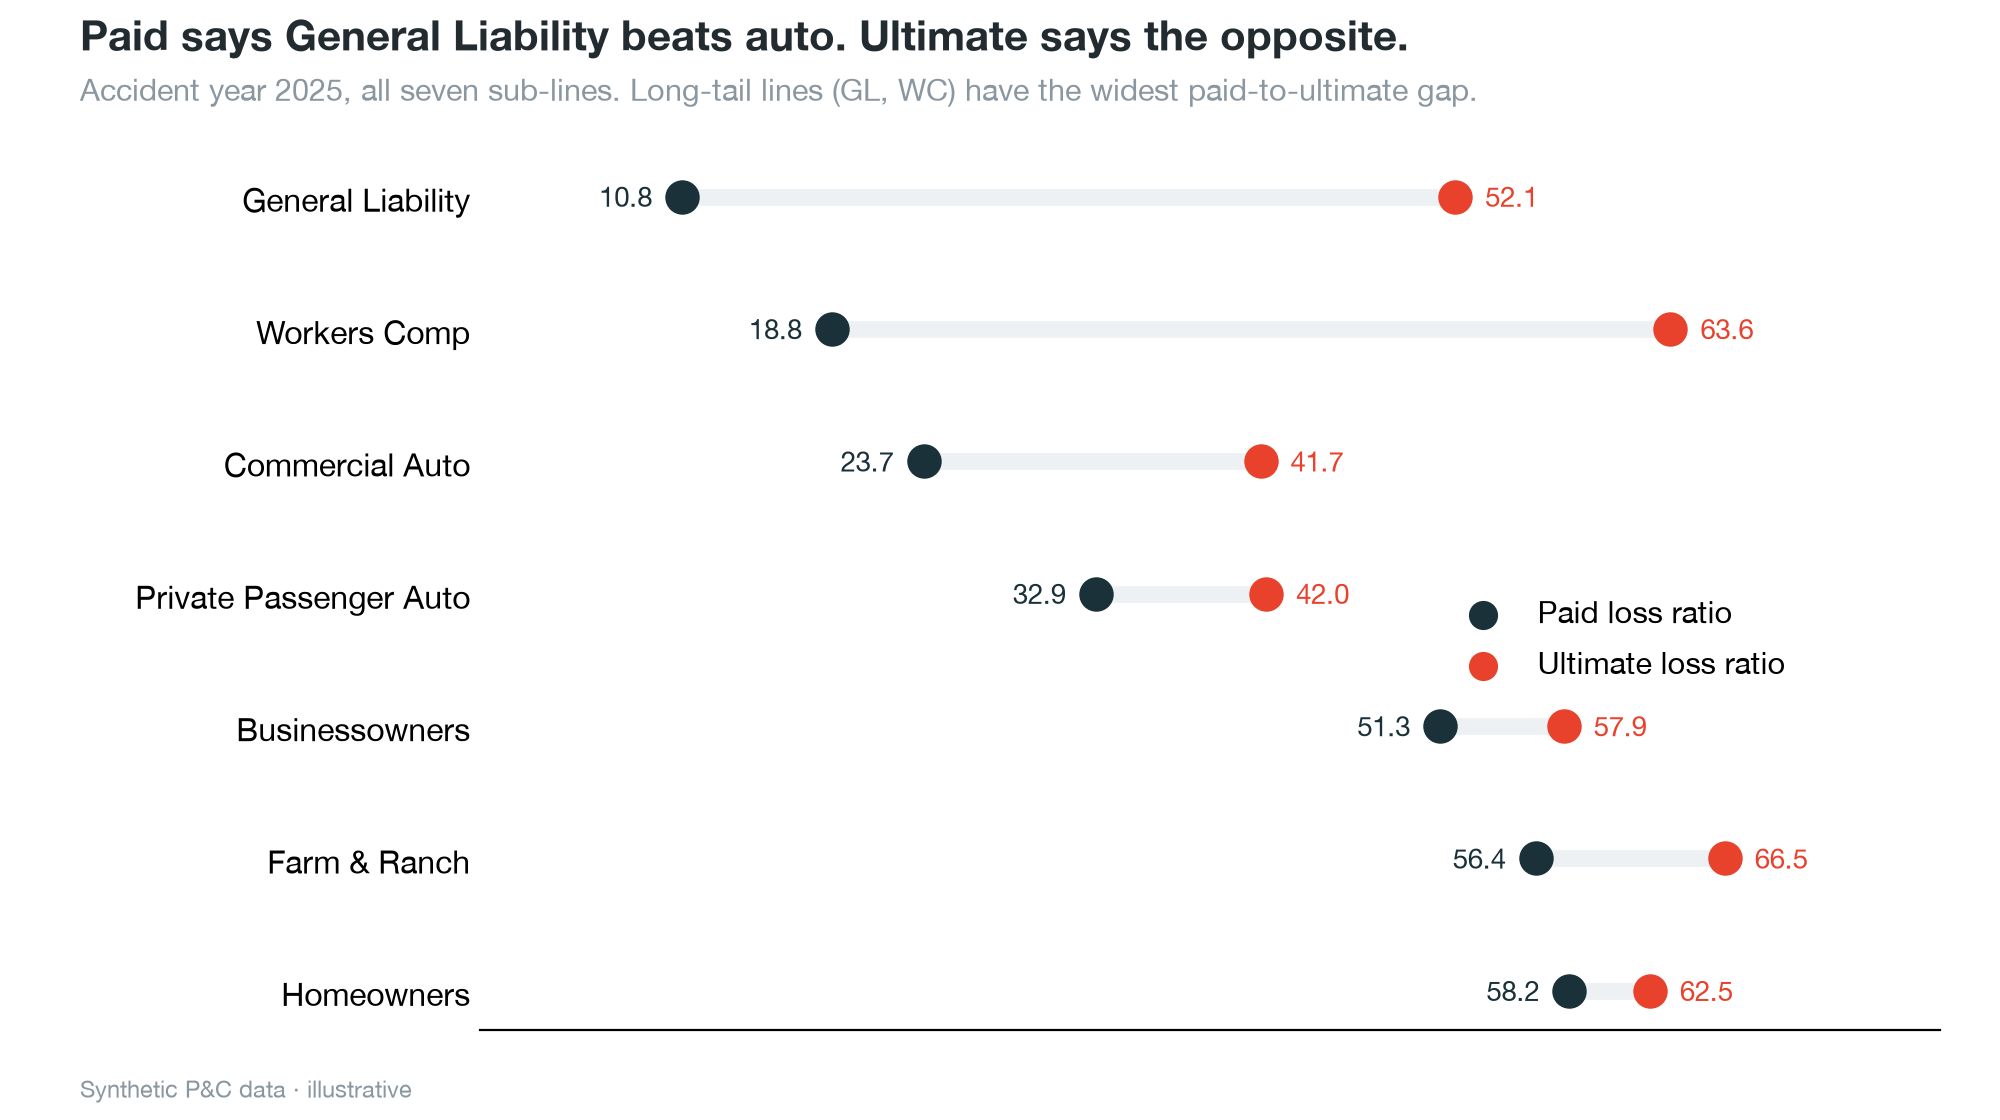
On a paid basis, General Liability looks like the best line in the book at 10.8%, comfortably ahead of private passenger auto at 32.9%. On an ultimate basis, General Liability is 52.1% and private passenger auto is 42.0%. The ranking flips. Workers Compensation tells the same story: 18.8% paid against homeowners at 58.2%, but 63.6% ultimate against 62.5%.
Auto and homeowners claims settle quickly, so their paid and ultimate numbers sit close together. The long-tail lines look artificially healthy until the claims develop. This is the classic misreading of long-tail lines, and it is one an AI agent will happily reproduce if nothing tells it otherwise. A decision to grow General Liability because it "looks" five times better than it is would be expensive.
Now the part I think is most useful. Think of it as an onboarding plan. I'll take the same question and ask what the AI coworker would produce as I teach it one more thing at a time: read the schema, learn the vocabulary, learn which files are yours, read the policy manual, learn which reports are retired, get a style guide, and finally sit a test.
Two caveats. The "ladder" of rungs below is a teaching device I use to separate the pieces, not an official Databricks term or maturity model, and you don't need to climb it in this order. And each rung's value is the result of the query an agent holding that level of context would write, executed live. Separately, I ran two real Genie Agents end to end, which I show after the ladder.
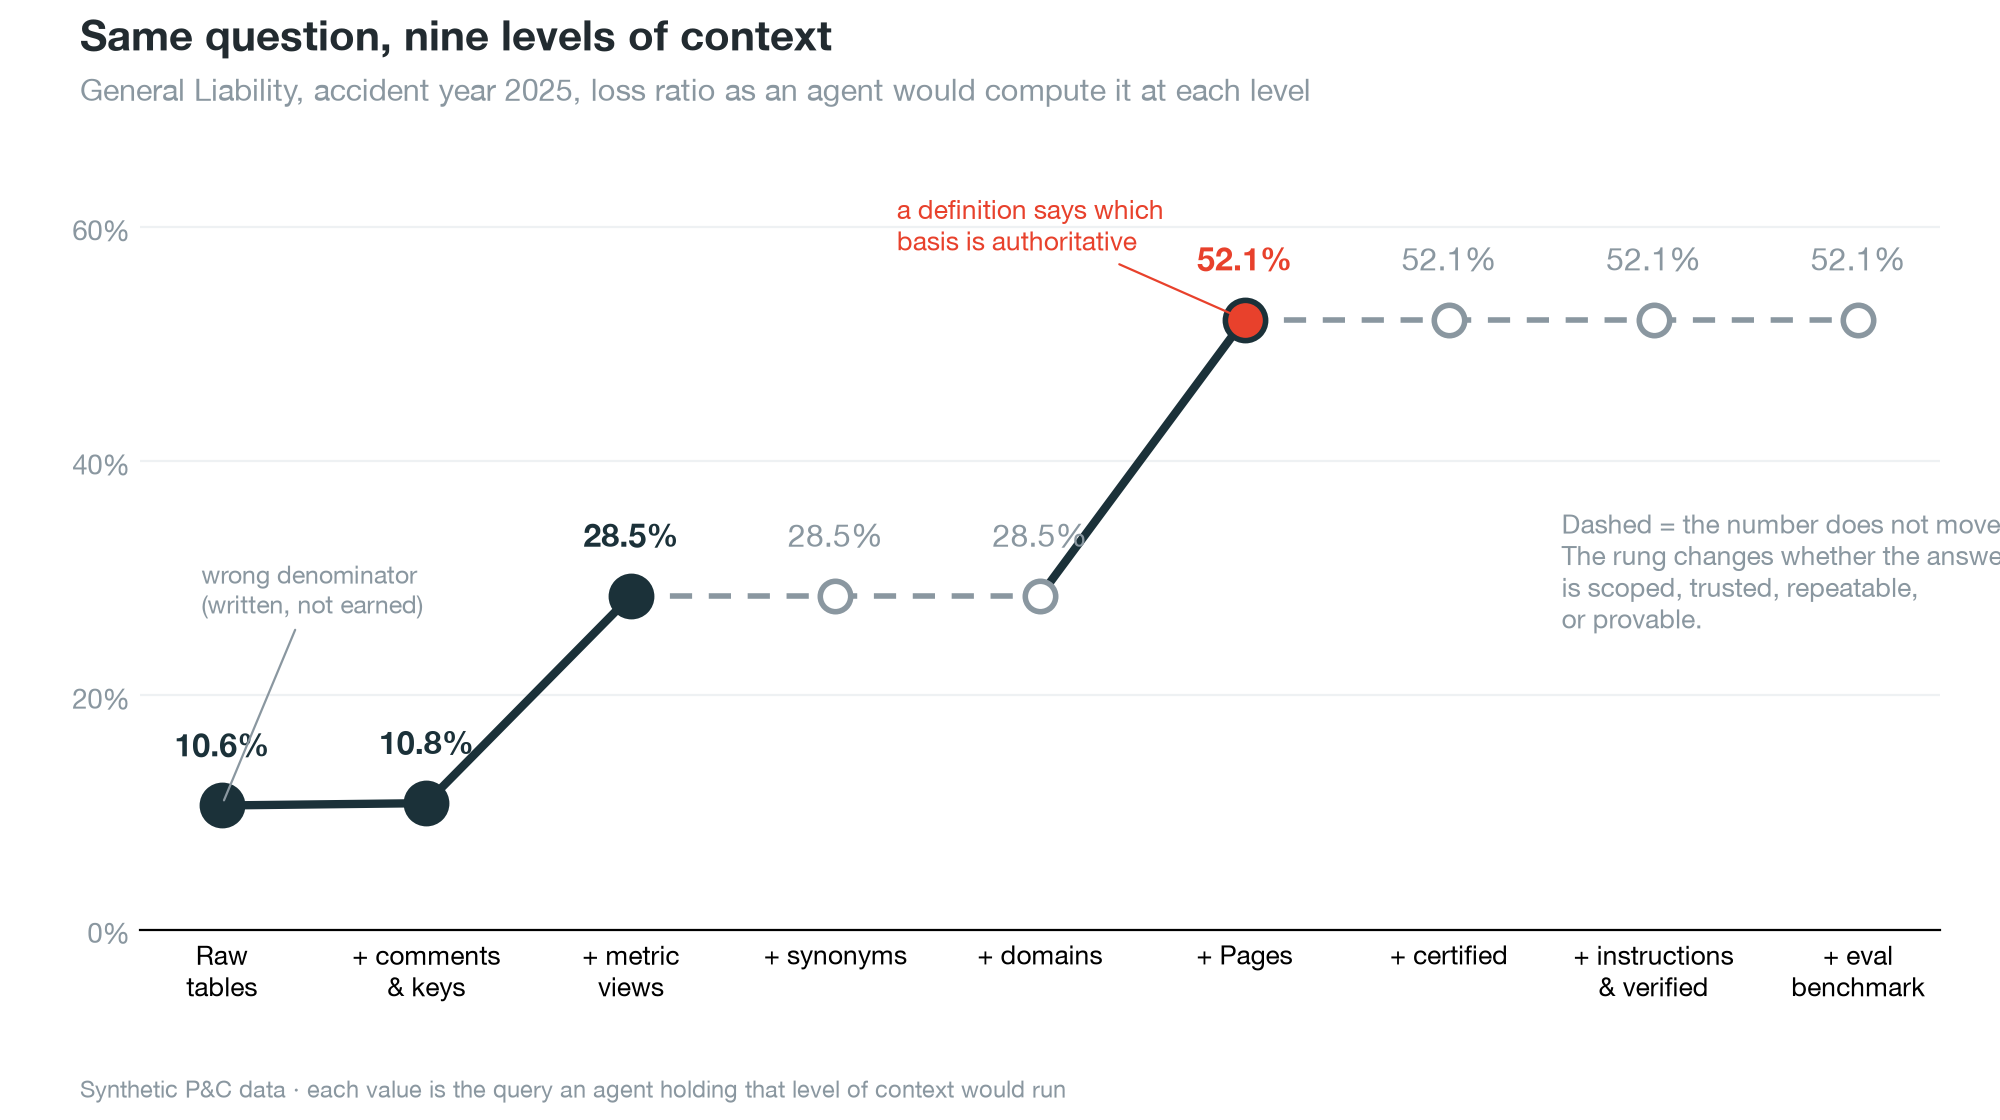
Two things stand out before we go rung by rung. Only four rungs change the number. And the number becomes correct at one specific rung, not gradually. I deliberately don't smooth that over, because the flat rungs are the ones teams tend to underinvest in, and they do real work.
No comments, no keys, no metric views. Column names are abbreviations. An agent looks at what's in the schema and finds an object that looks like a loss ratio: a legacy view, loss_ratio_v1. It sums the losses column and divides by the premium column.
SELECT ROUND(100 * SUM(losses) / SUM(premium), 1)
FROM loss_ratio_v1
WHERE sub_lob = 'General Liability' AND year = 2025;
-- 10.6
That is 892,495 of paid loss over 8,389,311 of written premium. Both errors push the ratio down. It reads as good news and it is wrong twice.
Add business descriptions to tables and columns, and declare primary and foreign keys. The docs are explicit that "Genie uses metadata to understand your data," and that "primary and foreign keys defined in your schema are automatically saved as join relationships in the Genie Agent."
Now the agent finds the right denominator, earned premium rather than written, and joins facts to dimensions as designed. The answer moves from 10.6% to 10.8%. That's a small move, and it's still wrong, because nothing distinguishes the paid column from the incurred column. It picks paid.
This is the first big step. A metric view defines the measures once, as governed objects, and users or agents group by whatever dimension they want at query time. In our build, mv_loss_ratio exposes the bases as separately named measures. An excerpt:
version: 1.1
source: catalog.schema.gld_fact_underwriting_result_monthly
measures:
  - name: paid_lr
    expr: SUM(source.ay_paid_loss) / NULLIF(SUM(source.earned_premium), 0)
    display_name: 'Paid Loss Ratio'
    comment: 'Paid loss over earned premium, accident-year basis. STRUCTURALLY TOO LOW
      for any immature period, and severely so for long-tail lines.'
  - name: incurred_lr
    expr: SUM(source.ay_case_incurred) / NULLIF(SUM(source.earned_premium), 0)
    comment: 'The governed default for SHORT-TAIL lines. Excludes IBNR, so it
      understates long-tail lines.'
  - name: ultimate_lr
    expr: SUM(source.ay_ultimate_loss) / NULLIF(SUM(source.earned_premium), 0)
    comment: 'The governed default for LONG-TAIL lines.'
Querying it is one line: SELECT MEASURE(ultimate_lr) FROM mv_loss_ratio WHERE .... The docs describe metric views as "the core implementation of Unity Catalog semantics," and you can query them "from SQL editors, notebooks, dashboards, Genie Agents, and alerts," which is why the same definition serves a dashboard and an agent.
The agent now answers with a real, governed loss ratio instead of its own column arithmetic: 28.5% on a case-incurred basis. It is defensible. It is also still wrong for this line, because there are six measures and no rule about which one applies. Case-incurred excludes IBNR, which is most of a young General Liability year.
One design decision here deserves attention. There is deliberately no measure called loss_ratio. If there were, an ambiguous question would get a confident single answer and the ambiguity would be resolved silently, by whoever wrote the YAML. By leaving it out, the question has to be resolved by something accountable, which is where Pages come in.
Add synonyms and display_name to the metric view fields. The docs say "each field or measure can have up to 10 synonyms," each up to 255 characters, that this requires Databricks Runtime 17.3 and YAML version 1.1, and that for Genie Agents "synonyms are automatically imported to help Genie better discover and understand available fields and measures."
The number doesn't move. What changes is reach. An actuary says "AY LR," an underwriter says "booked loss ratio," a finance analyst says "reported loss ratio." Without synonyms, three people asking in three dialects can land on three different measures. With them, they land on one. This rung buys consistency across people, not a different number for any single person.
Domains organize assets by business area. They're built on governed tags and are "an organization layer that groups data products and assets by governed tags." A subdomain follows the pattern {parentDomainTag}/{subdomainName}, so you can have Insurance/Actuarial or Insurance/Claims. Genie Agents can be tagged and added to domains too.
Again, the number is the same. What changes is the search space. Instead of choosing among every table in a workspace, the agent is choosing among the handful that belong to the Actuarial domain. That is the difference between a reliable answer and a lucky one, and it grows more important as your estate grows. Domains are an account-level concept, and tagging an asset with a subdomain tag does not automatically tag it with the parent.
This is the rung where the answer becomes right.
A Page is a governed definition of a business term, with a domain, an owner, synonyms, a description, a rich-text body, related assets, and sources. Here is the heart of the Loss Ratio Page in our build:
The governed default. When a request does not name a basis, the authoritative answer is the all-in, gross, accident-year, case-incurred loss ratio on earned premium, except for long-tail Commercial lines (General Liability, Workers Compensation), which are reported on an ultimate basis because case-incurred at 12 months is not yet meaningful.
Common error. Comparing a paid loss ratio on a long-tail line against an incurred loss ratio on a short-tail line and concluding the long-tail line is more profitable.
That's an actuary's rule, written once, in plain language, in a governed place. And here is what the docs say Genie does with it: Genie One "prioritizes the Page's definition over context it infers automatically, and cites the Page so users can confirm the source."
So the agent applies the rule, picks ultimate_lr, returns 52.1%, and points to the Page. The reader can check the reasoning instead of trusting the number.
This is the rung where "semantics" stops meaning "metric definitions" and starts meaning "judgment." The metric view tells the agent what can be computed. The Page tells it which computation is the authoritative one, and why.
Two practical points. Published Pages are available in all Genie One conversations, while draft Pages are restricted to conversations with the Page owner, so publishing is part of the rollout. And every Page must attach to a domain or subdomain, which is a good reason to do rung 4 first.
The number holds. What this rung prevents is regression. Without a trust signal, a deprecated legacy view looks exactly as authoritative as the governed metric view: same schema, plausible name, confident number. In our build, the legacy loss_ratio_v1 table returns 10.6% for this exact question. Tag it deprecated and you give the system a reason to steer away from it.
SET TAG ON TABLE catalog.schema.loss_ratio_v1
  `system.certification_status` = `deprecated`;
SET TAG ON TABLE catalog.schema.mv_loss_ratio
  `system.certification_status` = `certified`;
The docs describe certified as meeting "internal standards for accuracy, completeness, and trust," deprecated as "outdated, no longer reliable, or should not be used in new workflows," and say certification "helps Genie One improve its answers by prioritizing the assets your organization vouches for." You need the ASSIGN permission on the system.certification_status governed tag, plus APPLY TAG on the object.
Certification is what makes rung 5 reproducible instead of lucky.
The first follow-up is where many demos fall apart. The user asks for ex-cat. Then net of reinsurance. Then calendar year instead of accident year. Each of those is another place to pick the wrong basis.
A Genie Agent lets you curate for exactly this: general text instructions, example SQL queries, SQL expressions for measures and filters, and trusted assets that return verified answers. The docs note that "when Genie uses a trusted asset to answer a question, it provides a verified answer, giving agent users an extra layer of confidence."
In our build the actuarial agent's instructions restate the Page in operational terms. A representative piece:
LONG-TAIL lines (General Liability, Workers Compensation): use MEASURE(ultimate_lr).
SHORT-TAIL lines: use MEASURE(incurred_lr).
ALWAYS name the basis in your answer.
NEVER use MEASURE(paid_lr) as an answer to a general profitability question.
EARNED PREMIUM IS THE ONLY DENOMINATOR.
The key line is the one that says to name the basis. An answer that states its basis can be audited.
Everything up to here is a claim about quality. A benchmark turns it into a measurement. Per the docs, a Genie Agent can hold up to 500 benchmark questions, each optionally paired with a SQL query whose result set is the correct answer, and anyone with CAN EDIT can run them all or a subset.
Our build uses a 30-question set designed so that each question tests a specific trap. A few examples:
This is the rung teams skip and the one architects ask about first. It's the difference between "the demo looked good" and "we can re-run this after every change to the data or the model, and see whether quality moved."
The ladder shows the mechanism. To check it end to end, I created two Genie Agents over the same data on the same SQL warehouse. One points at an ungoverned copy of the tables: cryptic column names, no comments, no constraints, no metric views, no instructions. The other has the full ontology. I asked both the same question.
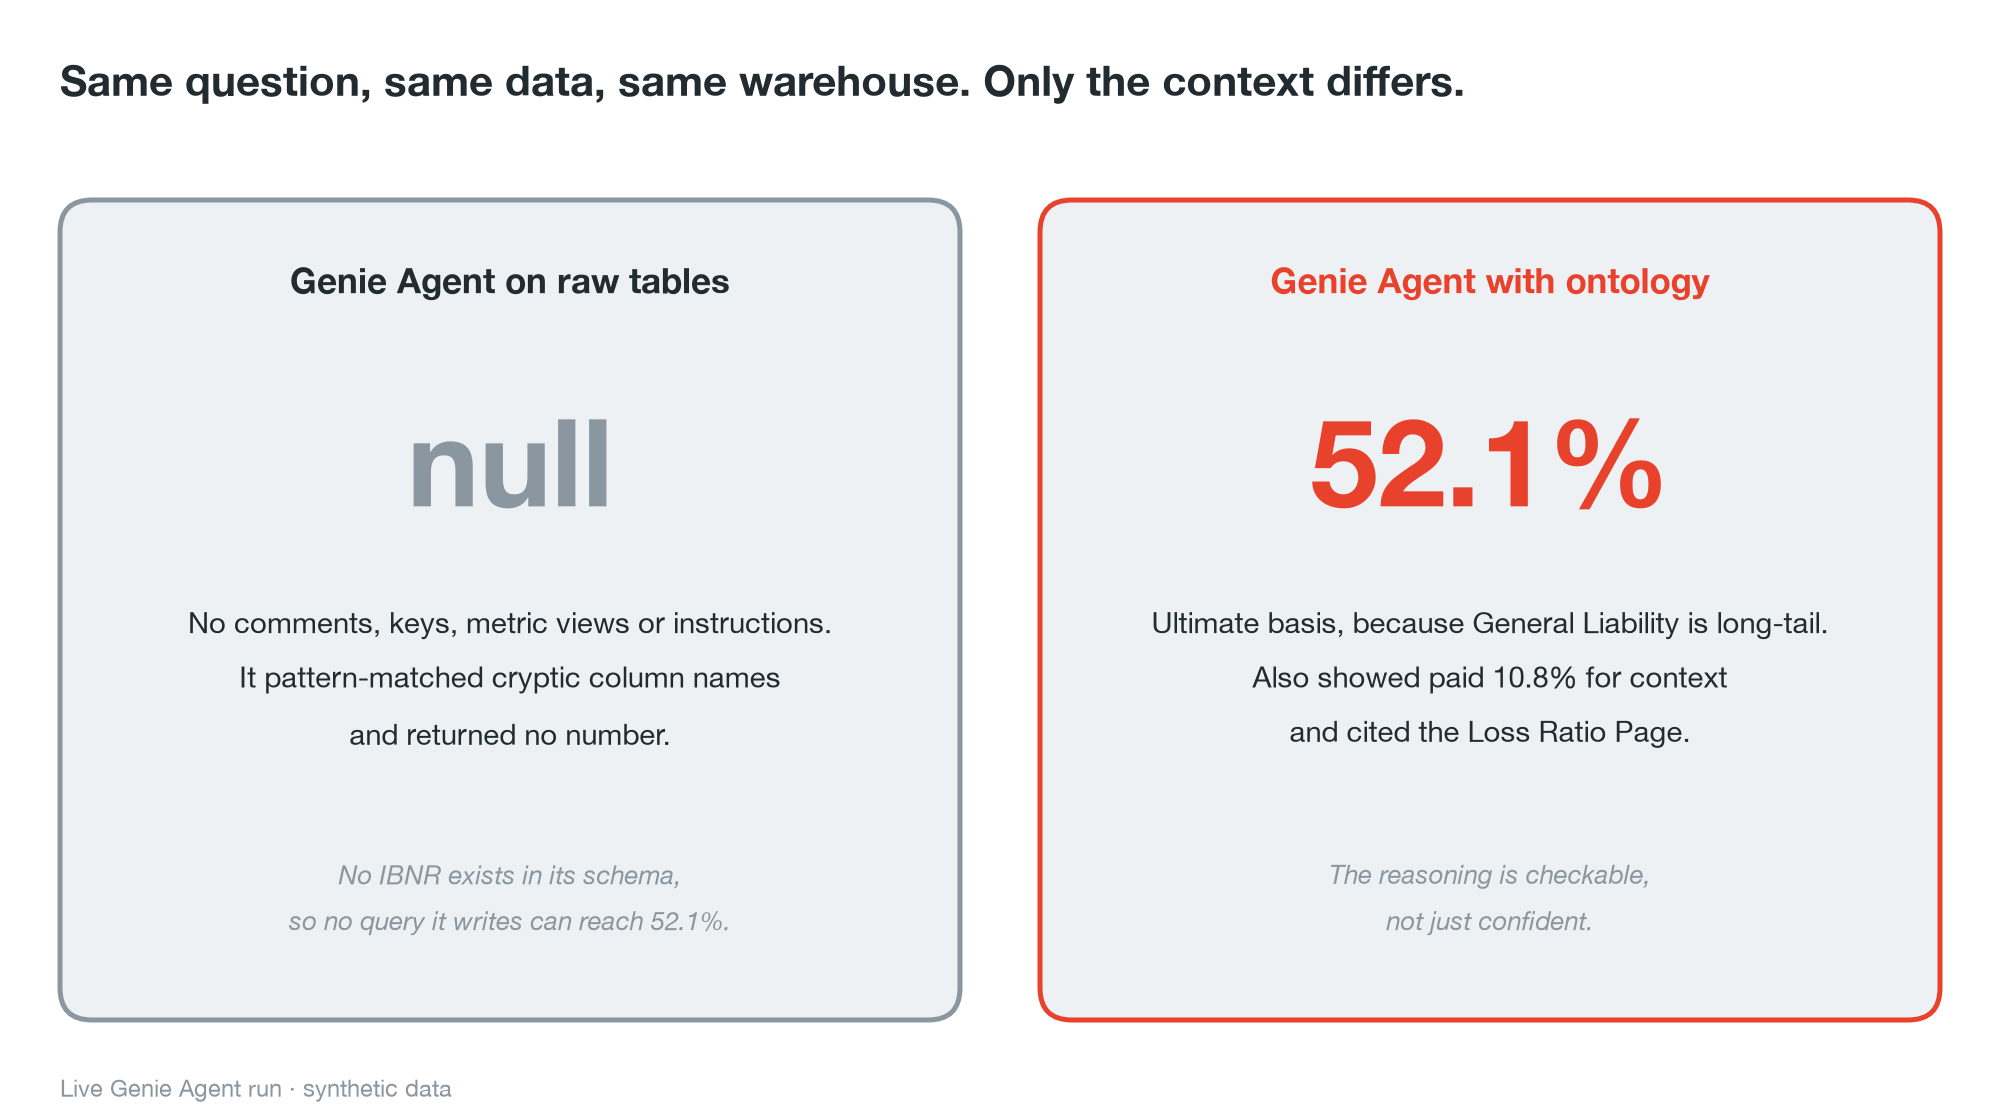
The ungoverned agent wrote SQL that pattern-matched on cryptic column names looking for "commercial general liability" and returned a null. No answer at all. It also has no IBNR anywhere in its schema, so no query it could have written would reach 52.1%.
The governed agent answered 52.1% on an ultimate basis, mentioned the 10.8% paid figure for context, noted that the gap reflects a long-tail line, and cited the Loss Ratio Page. Its SQL used the governed measure rather than column arithmetic:
SELECT ROUND(100 * MEASURE(ultimate_lr), 1) AS ultimate_loss_ratio_pct,
       ROUND(100 * MEASURE(paid_lr), 1)     AS paid_loss_ratio_pct,
       ROUND(MEASURE(earned_premium), 0)    AS earned_premium
FROM mv_loss_ratio
WHERE sub_lob = 'General Liability' AND accident_year = 2025
Two honest notes on this. It is one question and one run, not a statistical evaluation. And a model's behavior varies run to run, which is exactly why rung 8 exists. The point of the A/B is that the failure on the raw tables is structural: the information needed to answer correctly isn't there to be found.
Pulling back from the example, here is what I take from it.
Onboard the AI coworker the way you'd onboard a person. Nobody hands a new actuarial analyst a database login and walks away. They get the glossary, the reporting conventions, and a list of which reports are retired. The ontology is that onboarding packet, written once and read by everyone, including the AI.
The definitions already exist. The work is writing them down in a shared place. Every insurer already has a loss ratio policy, a reserving convention, and a list of retired reports. Today they live in memos, in a BI tool, or in someone's head. The ontology gives them one governed home that people and AI both read.
Start where disagreement is most expensive. You do not need to model the whole enterprise. Pick the five metrics that most often produce two different numbers in two different meetings. Loss ratio, combined ratio, earned exposure, retention, and frequency are common candidates. Model those first.
Build it in the order of the ladder (the steps are in "How can you try this yourself?" below), and write the benchmark from the questions that previously caused arguments.
Governance carries through. These are Unity Catalog objects, so the permissions model applies. Genie Agents evaluate access using each user's own permissions, and row filters and column masks are enforced per user. Attribute-based access control (row filter and column mask policies are generally available) can mask claimant details or scope rows by state without rebuilding anything for the AI layer. Page text and domain metadata are plain text, so keep sensitive data out of them.
The dashboard and the AI stop disagreeing. If your executive dashboard and your Genie Agent both read mv_loss_ratio, they cannot drift apart without someone noticing. That is a quiet benefit and a large one.
An AI coworker writes SQL well. What they lack is the knowledge that makes SQL right for your business: which loss ratio is the official one, which table was retired, and what "accident year" means here. That knowledge has always existed inside insurers. The Genie Ontology is a way to put it in the data layer, under governance, where people, dashboards, and AI agents all read the same thing.
On one question, the answer went from a confidently wrong 10.6% to a correct, cited 52.1%, and the model never changed. The context did. Hiring the coworker was the easy part. Onboarding it is the work.
SET TAG statement per object. Do it when you publish the metric view, not as a cleanup step, and check that the tag actually landed.You can build the same thing incrementally. You don't need to model the whole enterprise.
What is a Genie Ontology? The unified context layer Genie uses to interpret your data. It combines context you model and govern in Unity Catalog (metric views, domains, Pages, certification and deprecation) with context Genie infers from metadata, keys, lineage and usage. Modeled context takes precedence.
What is the difference between a metric view and a Page? A metric view defines how a number is computed. A Page defines what a business term means and which computation is authoritative. In the example above, the metric view makes the ultimate loss ratio computable, and the Page is what tells Genie to use it for General Liability.
How do I know whether it is getting better? Write benchmark questions with expected answers and re-run them after every change. A Genie Agent supports up to 500 benchmark questions.
All Databricks documentation below was reviewed on October 21, 2026. Features and statuses change, so check the pages for current state.
All data in this post is synthetic and illustrative. "Ladder" is an illustrative device used in this post, not a Databricks term.